Measuring The Web Page Performance with YSlow
There is a number of tools (and a growing number!) that allow you to measure the performance of your Web applications. Performance can be defined in various domains: the technical (i.e. network) side, the performance of the client displaying your pages, the effectiveness of your site layout etc. In general it is called "Web Analytics".
I would split the Web performance measurement tools available today into the following groups:
- Web server log analyzers. These tools are the oldest ones. All they can do is to crunch your log files (that contain very limited set of information) to show you who are coming to your site, where do they go, how long they stay there etc. This approach allows you to see the traces of all the people who successfully use your site at some point.
- Web Analytics products (Google Web Analytics, Microsoft Gatineau project). They allow you to transparently (almost) track the users coming to your site by tagging their sessions using cookies. You just insert a code fragment in every page on your site and once someone loads the page a piece of Javascript code gets executed, it contacts the service provider (Google for example) and reports a hit. A lot of information can be extracted at this point and more information can be obtained from analyzing the history. And there are no log files to share. However, if someone disables Javascript or cookies…
- High-level traffic analyzers based on the network monitors. These products are most powerful because they require nothing special on the server side and on the client side. They listen to the traffic close to the Web server, reconstruct the HTTP requests, then build HTTP sessions etc. Since they have access to the actual raw data in the real network they can identify almost all imaginable problems from the link level to the HTTP session level. However, they will not tell you why nobody comes to your online store ;)
- Client-side tools. I would say these are for the Web developers. There is no way you can install something special to every single Web user that will report the results back to your site (this would be called "spyware"!). However, the client side of a Web application is a perfect point for analyzing its performance from the point of view of this user. This is the group where new tool called YSlowfrom Yahoo! Developer Network perfectly fits to.
With YSlow you can:
- Get a performance record card for any page you are visiting (including a local one)
- See the HTTP and HTML summary for the page (i.e. for all the components that your page consists of)
- Use additional tools like JLint
YSlow is based on another free product called Firebug which is a development tool for the Firefox browser. Getting and installing both takes 1 minute and you have to restart Firefox. Once you are done, open and enable Firebug (Tools -> Firebug) and then click on “YSlow” tab.

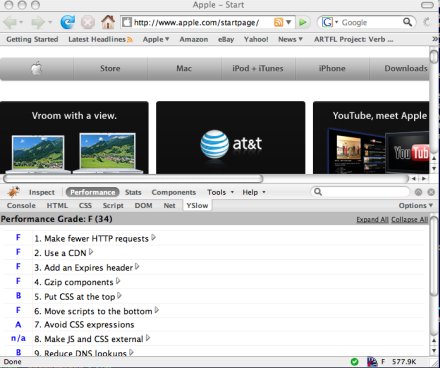
The image above shows what does YSlow think about the Apple home page. “F” rating does not seem to be very high. As you can see, YSlow offers a number of performance metrics that it uses to calculate the average page grade. There are not too many metrics and most of them are quite obvious. However, from my point of view the real value of YSlow is that it allows you to quickly get this information for any page that you can open with your browser. You can expand each of these items to get more details:

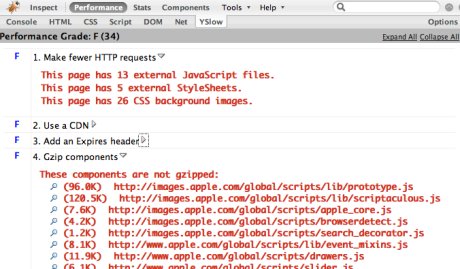
As you can see, Yahoo! believes that 26 CSS background images is a lot (interesting how did they establish the limits, do they actually take into account the image size or not etc). However, if you forget about the grade “F” for this category, you clearly see that it took my browser 13 + 5 + 26 = 44 HTTP requests (actually, YSlow does not show all the requests here so the real number is higher) to completely load the page. The question is not about “F” or “B”, the question is “can I make it 40 instead of 44 without having to redesign everything?”.
Also, GZIP'ing the 120Kb javascript file would help a lot (see the “Gzip components” item).
Another interesting thing is that you can click on each of these items and get a Web page from Yahoo! explaining the meaning of it (what is CDN for example), how does it affect the performance of your site and how to configure this particular feature (like ETags in Apache).
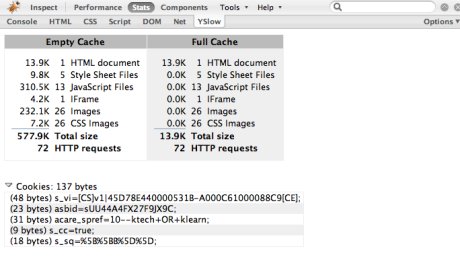
Clicking on the “Stats” gives the following screen:

After looking at this screen I would question the “F” grade shown by YSlow for this page. At least making sure that all the resources do not get reloaded every time if they are in the cache is quite good. This screen gives a good and brief summary about the page and all the resources it depends on for two cases: first load and reloading the page assuming that the browser has all the resources in its cache.
Seeing the cookies summary is another interesting thing. Sometimes you may be surprised how many sites set the cookies incorrectly without restricting them to certain domain and path.

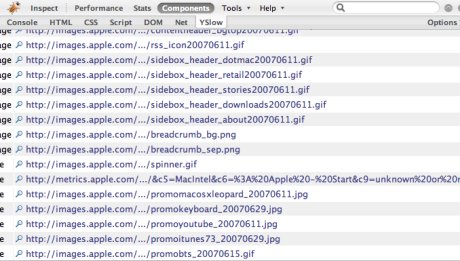
Nothing fancy here, it just provides the list of all the resources the page depends on. You can get the same list by using “Page info” menu in Firefox.
Tools view provides a coupe of additional options you can use such as:
- Getting one-document printable view of all the information shown in the Performance and Stats views
- Displaying all CSS styles in one file (quite useful to look for potential duplicates and other sorts of optimization)
- Same thing but for the Javascript code
- JSlint tool that can show potential problems with the Javascript code used on the page
Just to summarize, I would say that YSlow is a really nice tool for the technical analysis of the Web pages if you know how to interpret its results. I would ignore the Yahoo! grades and would not bother too much about moving from 40 to 60. At the end, it is the Yahoo! way of calculating the weight of each of these factors contributing to the development of the high-performance Web applications. Personally I like it because:
- It is free
- It allows me to get the information very very quickly for ANY web page
- It provides the numbers for the metrics measuring the quality of the Web page that I consider important
blog comments powered by Disqus